
There is a plethora of data, graphs, and charts.
Those provided by the U.S. Energy Information Administration are highly regarded.
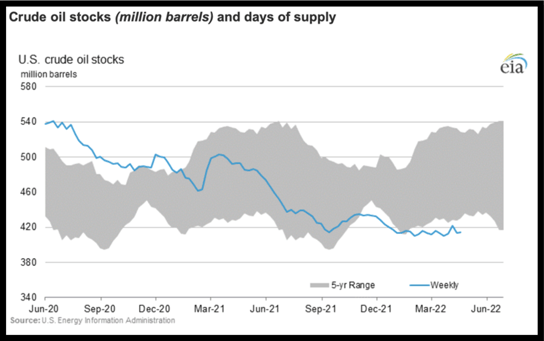
Of all the info that is available, this is the chart that currently stands out most to me. The gray area is the 5-year range of what crude oil stocks have been. The blue line is what the weekly supply currently is. You can see going back a couple of years that the weekly supply at the time was higher than the 5-year range had been. (If you remember, 2020 was kind of a big deal.)
However, moving forward to present day, the weekly supply is trailing the 5-year range. Granted, this chart is missing the demand curve. Nonetheless, given what you currently know and predict, do you have any reason to believe that the demand is going to drop off anytime soon to such a level that there will no longer be an immediate supply concern? This is why we’re seeing $100 oil. To take it even further, visit this chart, in which you can also see the number of days of supply. We’re currently at 26 days of supply. If you have a different take on this, we would love to hear from you.
Not too long ago, several energy executives were requested to testify to a panel/committee/witch hunt regarding high gasoline prices. One of the points that was frequently brought up is that with excess profits, companies are returning that money back to shareholders in the form of dividends and share buybacks instead of drilling more wells. (Never mind they don’t understand the full drilling/completion/production process.) Reminder, the executives are not the owners of the companies; the shareholders are. So, if the shareholders want their investment/money back, they have every right to request it.
Wall Street Journal
"Exxon and Chevron, Buoyed by High Oil Prices, Shower Investors With Cash"
- ExxonMobil – “The U.S. oil giant said it would triple its share repurchases, but will keep oil-field spending at a modest pace.”
- Chevron – “The company has paid out $4 billion to investors in dividends and share repurchases this year.”
- France’s TotalEnergies – “it could double its share buybacks this quarter.”
- “Energy executives say that sustained pressure from investors to return more cash to shareholders is the primary factor holding back investment in growth.”
- “To a lesser extent, cost inflation is also deterring production growth as shortages of equipment and labor have become widespread in the U.S. shale patch.”

The tech tip you need to know:
How to use pivot tables.
The pivot table takes a few minutes to learn how to set one up and get basic utility, but it may take hours of practice to get all the use out of it. Have you ever had a spreadsheet of leases, and you have wanted to know how many leases in which county have which status? You could use the filters on your spreadsheet to individually select the counties, count the number in each one, and then count the status for each one, and then create a summary of the math you did. Or you could use a pivot table and create the summary you are looking for instantly. Check out the video below to learn how to use pivot tables in just a few minutes.
How Intelligent are Your Land Operations?
Let's chat. Email jjohnson@paramount.io for questions, commentary, and invitations to speak.